How tricky currents play a part in the closing stages of the Rolex Sydney to Hobart Race
The last few miles of a Sydney to Hobart race has often determined the ultimate winner. Capricious, shifty wind and 'bullets' - gusts that come screaming down the steep hillsides lining the course are often to blame. Not to mention the notorious night time 'shut-down' - where the wind disappears entirely.
The role of currents here has been overlooked - most likely because little information has been publicly available. This is set to change thanks to a new hydrodynamic model produced by the Coastal Environmental Modelling Team at CSIRO which Tidetech will be making available for the Sydney, Melbourne and Launceston to Hobart races this year as part of a package of Grib files and analyses.
The model reveals the complexities of the region and in this article we will take a closer look at what factors are in play.
Fig 1.CSIRO Model output showing currents in Storm Bay, viewed in Expedition software
The sequences in the video above shows current flows across Storm Bay over a 48hr period. It's possible to see repeating patterns, but there is also quite a bit of variability. To understand what is happening we need to tease out the different factors which contribute to the whole picture.
These factors are:
1. Tidal regime
Most of Tasmania experiences semi-diurnal tides - i.e. two tides a day. The pattern is quite asymmetric, with one tide bigger than the other (except in Bass strait). This is called diurnal inequality and it is more pronounced at Springs than at Neaps, as can be seen in one week's tidal height prediction for Hobart: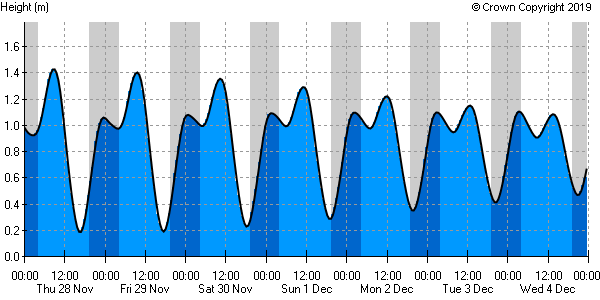
Fig 2.Tidal height prediction for Hobart from Admiralty Easy Tide
At Springs on the 28th November the range of tide (difference in height between a HW and LW) between HW at 0842 and LW at 1632 is 1.2m (highlighted in yellow), considerably more than the next ebb tide between 2335 and 0349 which was only 0.1m (highlighted in red).
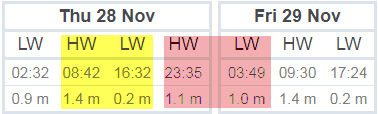
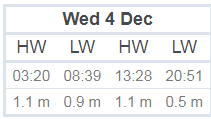
At Neaps on Weds 4th December the two HW's have a similar height, but there is still a large difference in the range of the two ebb tides.
The the two high tides become more equal in height as we head towards neaps, but there is still a significant diurnal inequality present. Also of note are differences in the shape of tidal curves between stations that aren't all that far apart, such as Pirates and Parsons Bays, both relevant to the closing stages of the Sydney to Hobart race:
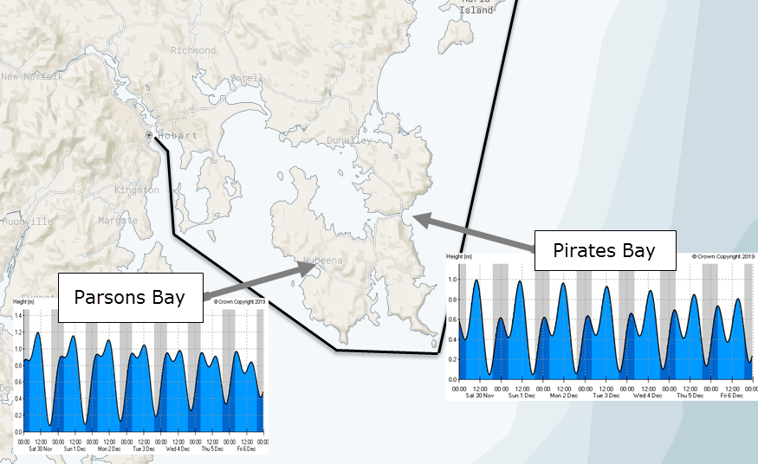
Fig 4.Tidal height prediction for Pirates and Parsons Bay from Admiralty Easy Tide
So what does this mean in practice? Clearly, sailors in Tasmanian waters should pay as much attention to the range of tide as to the timing of it, as stronger ebb or flood tidal currents will be experienced when the range is large compared to when it is small.
Also, local differences can be seen in the current direction, according to the bathymetry and topography of a region e.g. at the junction of North Bruny Island and Iron Pot at the mouth of the Derwent Estuary:
Fig 5 .CSIRO Model output showing currents in the lower Derwent Estuary and east of north Bruny Is, viewed in Expedition software
In the video above, the SW going ebb at Iron Pot is followed by a NE going ebb which exits the D'Entrecasteaux Channel. With this knowledge, a savvy navigator could keep west when rounding Iron Pot and steal a march on competitors that keep themselves glued to the rhumbline.
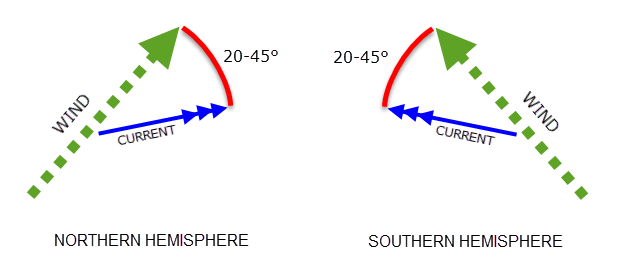
2. Wind driven currents
Friction between the wind and water at the ocean surface results in a surface current flow at between 20 and 45 degrees to the direction to which the wind is blowing. This effect will vary according to the depth of water, with smaller angles in shallow water and larger angles in deep water.
The speed of wind driven current is typically about 3% of the surface wind speed, so in 20kts wind you would expect 0.6kts and in 30kts 0.9 kts.
Tasmania resists the relentless westerly flow of the roaring forties, the wind wrapping itself around the island rather like water meets a rock in a fast flowing stream.
Fig 6 .High resolution satellite imagery showing four hour sequence of clouds passing over Tasmanis with associated forecast with streamlines.
Credit BOM, Windy.
A prevailing WSW flow between the southern tip of the island at South Cape and Tasman island ensures a persistent wind driven current flowing in a ENE direction, which could explain why there often appears to be adverse currents when rounding Tasman Island from East to West.
3. Freshwater outflows from rivers
Water flowing down any river that doesn’t have a physical barrier, such as a weir or barrage will end up in an estuary where fresh and salt will inevitably mix. This can take some time as the properties of salt and fresh water are quite different. Fresh water is less dense and lighter than salt water and so tends to sit in a clearly defined layer on top, often for quite some distance out into the mouth of an estuary. After heavy rainfall or during snow melt, this phenomenon becomes more pronounced.
Freshwater from the river Derwent makes its way out into the Derwent Estuary as a layer sitting on top of saltier water, the extent to which this layer influences surface currents further down into the estuary will depend on volume of water exiting the river. The mean Derwent discharge during the year varies between 50-140 m3/s with discharges in the December / January period amongst the lowest of the year.
Fig 8 .CSIRO Model output showing currents in the upper Derwent Estuary, viewed in Expedition software
The Mix
Given the low River Derwent discharges expected in December, the main factors affecting currents in Derwent Estuary / Storm Bay during the races are likely to be the tides and winds. Spring tides are predicted for the race start times so tidal currents will be important entering Storm Bay for the faster boats, less so for slower boats as the tidal phase heads towards neaps. Another factor influencing the currents at the entrance to Storm Bay is the strength of the Zeehan Current, which flows from South Australia anti-clockwise around west and south Tasmania. This current is strongly influenced by the prevailing winds. Often, there is a battle between the Zeehan Current and the southwards extent of the East Australian Current approaching Storm Bay from the east, but the evidence so far this year is that this southwards extension is weak, so less of an influence. The CSIRO model forecasts take into account all the major factors affecting currents in the Derwent Estuary / Storm Bay region, in this case likely to be tides, winds and Zeehan Current.
Tidetech is providing this CSIRO model for competitors in the Sydney to Hobart and Melbourne and Launceston to Hobart Races as part of a package of Grib files and analyses.