The creation of ocean current maps depend on the measurement of sea level, which is the base level for measuring elevation and depth on Earth.
The ocean is one continuous body of water, so while its surface tends to be the same level throughout the globe, factors like winds, currents and variations in temperature prevent the sea surface from being truly level.
Sea level is primarily measured using altimetry satellites in space, so until the 1990’s real-time information about ocean currents for routing across oceans was effectively non-existent. Mariners had to rely on paper routing charts which gave month by month averages of currents, based on historical data. This information, while useful, did not give details about ocean eddies or other dynamic features.
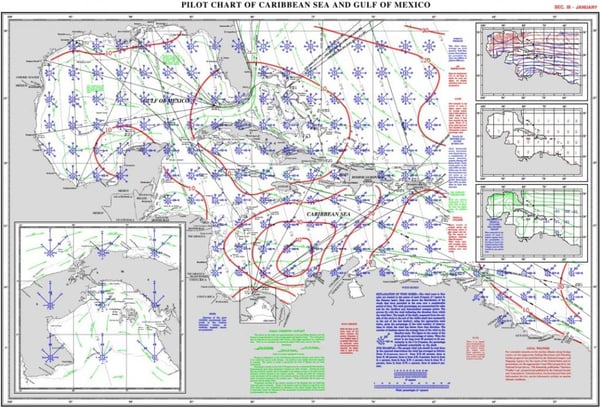 A traditional routeing chart
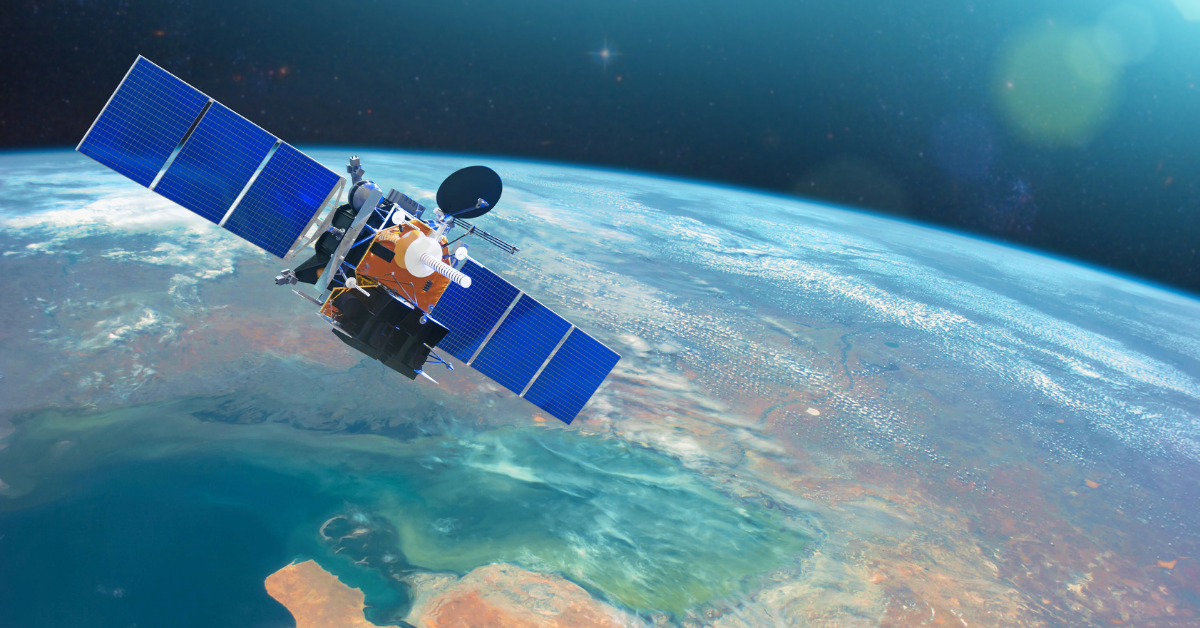
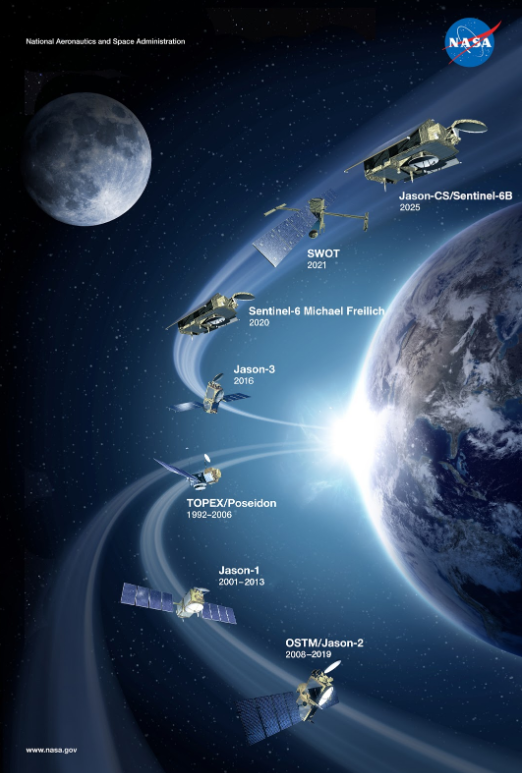
In 1992, NASA launched the first of a series of altimetry satellites with the ambition of measuring sea surface height in great detail, across the globe. Since then, a series of satellites have been launched with the same purpose, not just from NASA but from other countries as well.
These satellites use radar to measure the distance between their position and the sea surface, in a continuous series of narrow bands or swaths of about 10km wide, directly below the satellite.
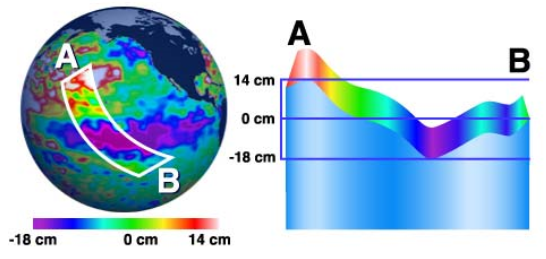
The satellites are able to capture data with incredibly high detail, and accuracy up to 10cm. The graphic below demonstrates how a band of data might look, showing the variation of sea level down to a few centimeters.
It takes several days to build up a picture of the sea surface from multiple tracks and in the image below you can see the composite tracks from two satellites over a ten-day period. The data shown is in relation to the average sea level, and the result we get is a map of sea surface height deviation.
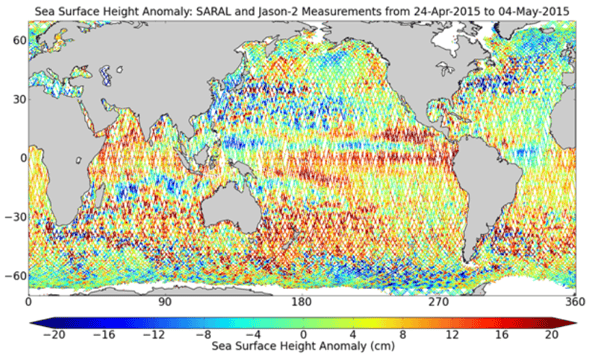
The image also shows the relative difference in sea surface height between adjacent areas in the ocean. Understanding and interpreting these differences is the key to producing near real-time maps of sea surface height and currents.
It’s also important to note that these maps are not a snapshot of sea level data at any given time, but a composite image using measurements that are taken over long periods of time.
Determining Ocean Currents From Maps of Sea Surface Height
The image below shows a map of sea surface height in the EAC (Eastern Australian Current) east of Sydney.
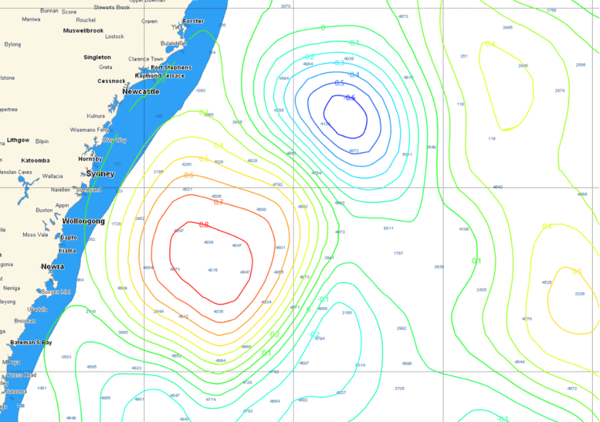
The contours represent lines of equal sea surface height and colours represent height above mean sea level (green to red) and below mean sea level (green to blue). You can think of these features as being like high and low-pressure systems in the atmosphere, but in fact they are warm and cold-core eddies caused principally by differences in the temperature, saltiness and density of seawater and made to rotate by the Coriolis force.
From these maps of sea surface height, scientists can determine the speed and direction of currents, in the same way as wind strength and direction is determined from maps of high and low pressure. Where the contours are steepest, the currents will be strongest.
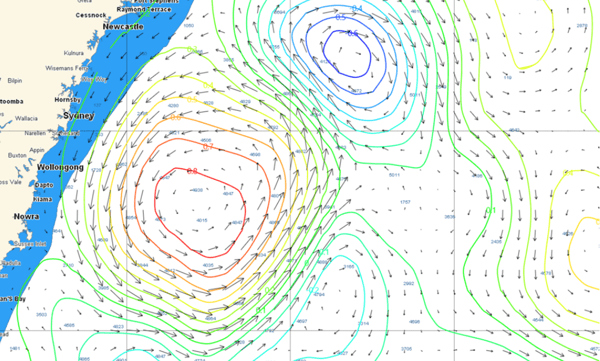
The image below shows the same map overlaid with arrows that give the current direction and strength.
Since it takes several days to build up a composite image of sea surface height, the information we receive is up to 5 days behind. As the ocean changes relatively slowly, this doesn’t matter so much in many places, but there are some key places important for mariners that are more dynamic such as the EAC, Gulfstream, Kuroshio and Agulhas Currents, and the quest is on to provide more up to date data for these regions.
The best way to achieve that is to have more altimetry satellites in circulation and this has become a priority for national scientific agencies, with altimetry satellites now in operation from the US, EU and India, with more planned over the next few years.
The video below is an animation by NASA of June 2005 to December 2007 based on a synthesis of a numerical model with observational data (created by the NASA project 'Estimating the Circulation and Climate of the Ocean', or ECCO for short).
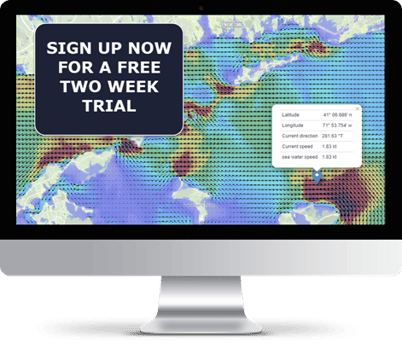
This is a fantastic demonstration of the incredible advances scientists have made in recent years in understanding and mapping the complex dynamics of our oceans. If you’re interested in learning more about how advanced data can benefit the planning of your ocean journeys, access our global Tidetech data for FREE by clicking the banner below.